

Insights
Stop reading reports. Start seeing patterns.
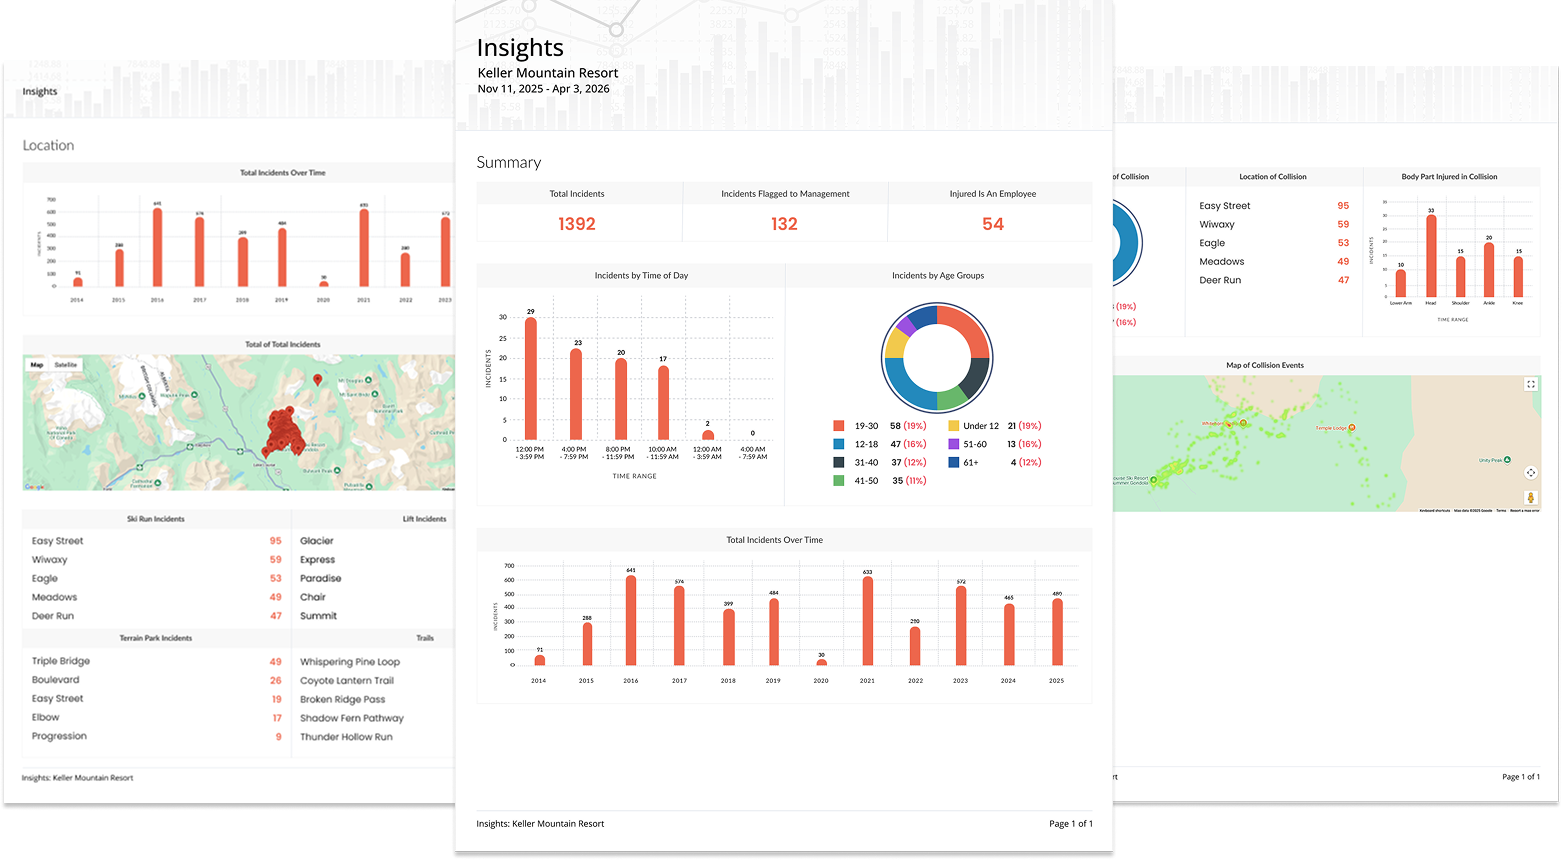
Turn incident report data into clear, actionable visuals with EDGEauditor Insights. Explore trends, identify high-risk areas and uncover patterns across your mountain through customizable charts, heat maps and dashboards — without exporting spreadsheets or manually analyzing reports.
Schedule a demo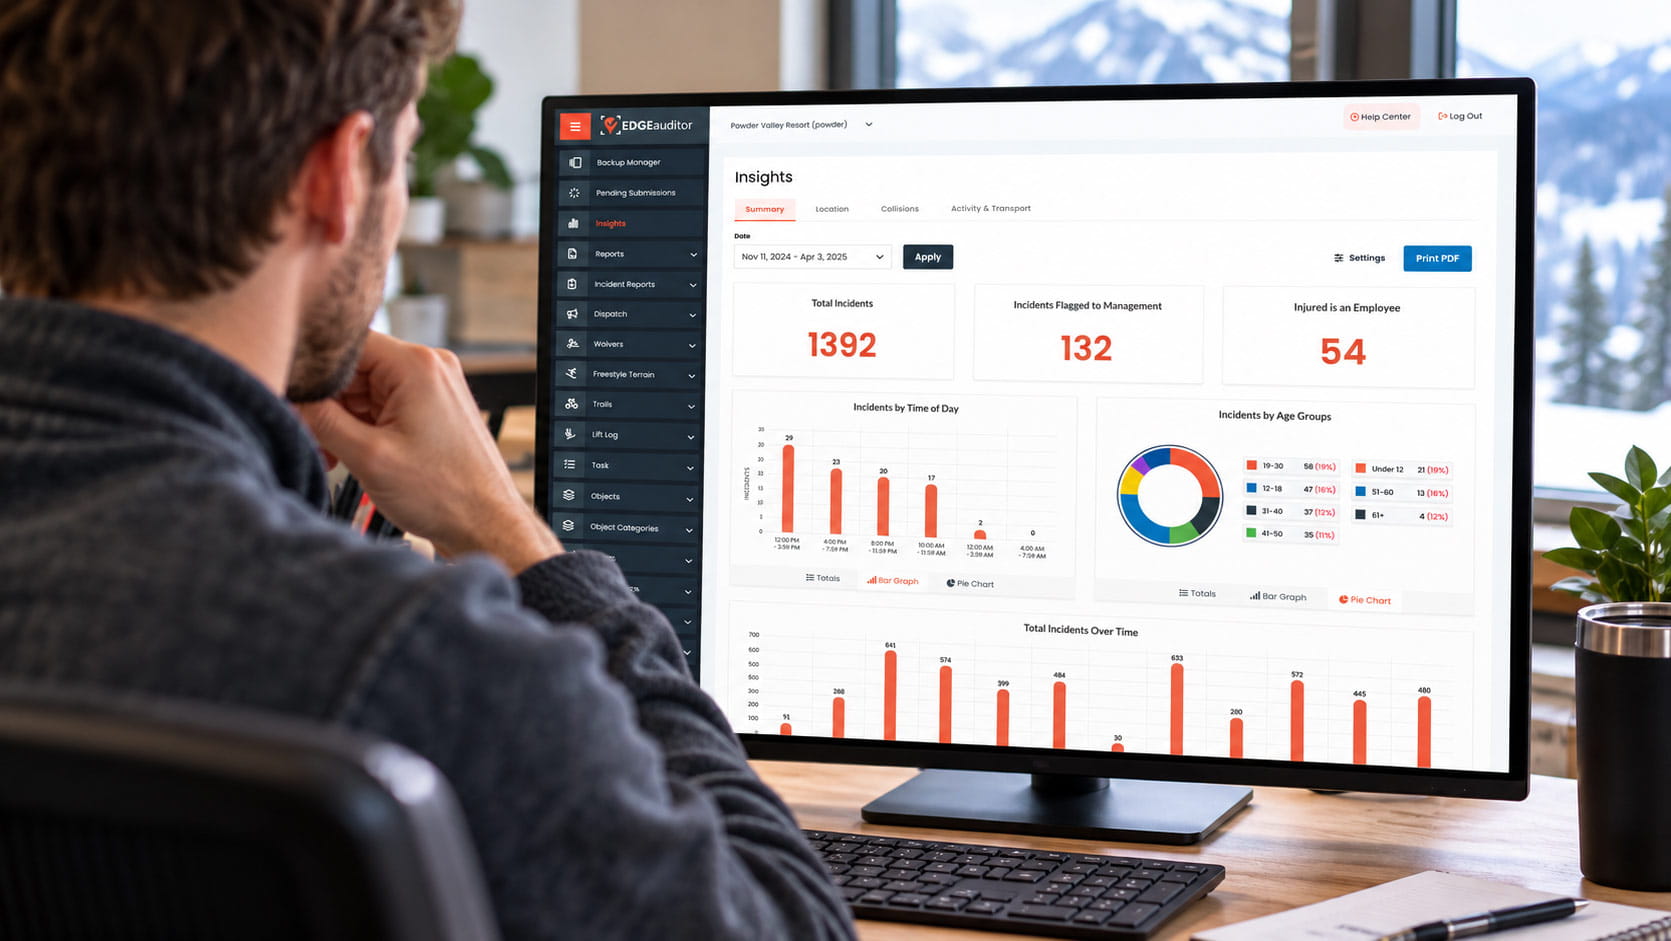
Your incident data. A clearer picture of your mountain.
Visualize Your Incident Data
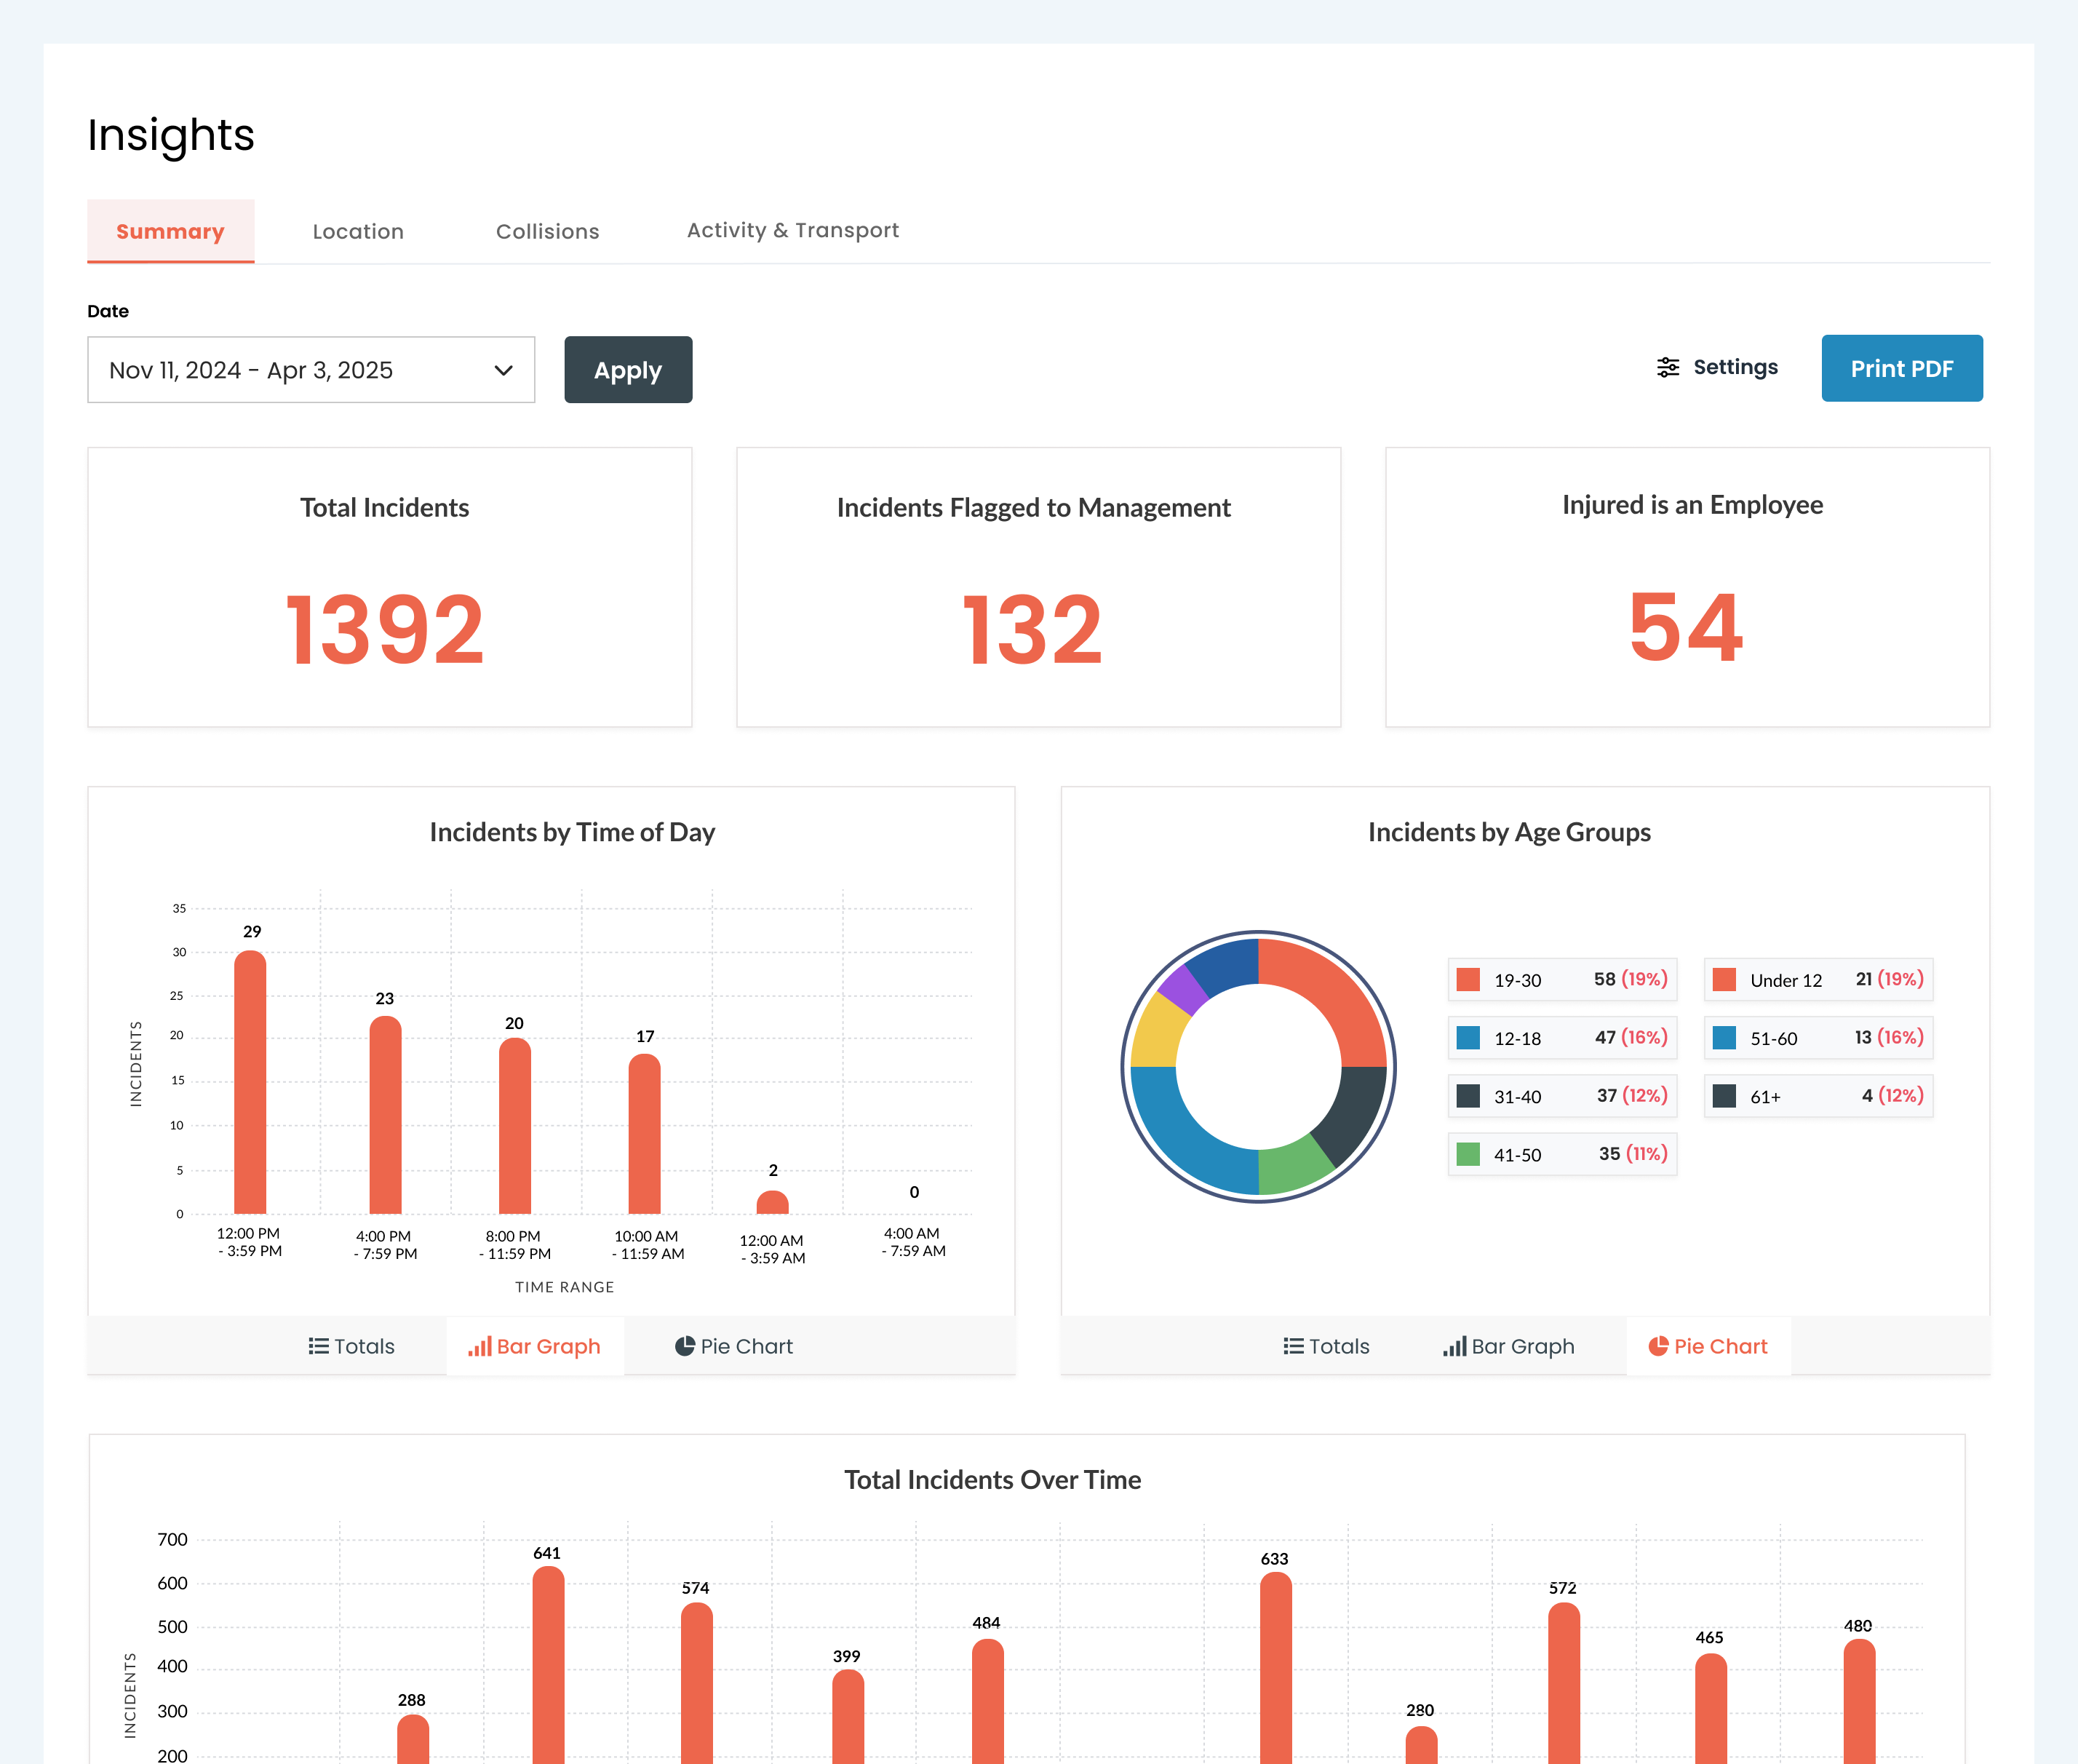
Turn incident reports into easy-to-understand charts and visual summaries. Explore incident frequency, injury types and other key metrics without spreadsheets or manual analysis.
Heat Maps & Risk Zones
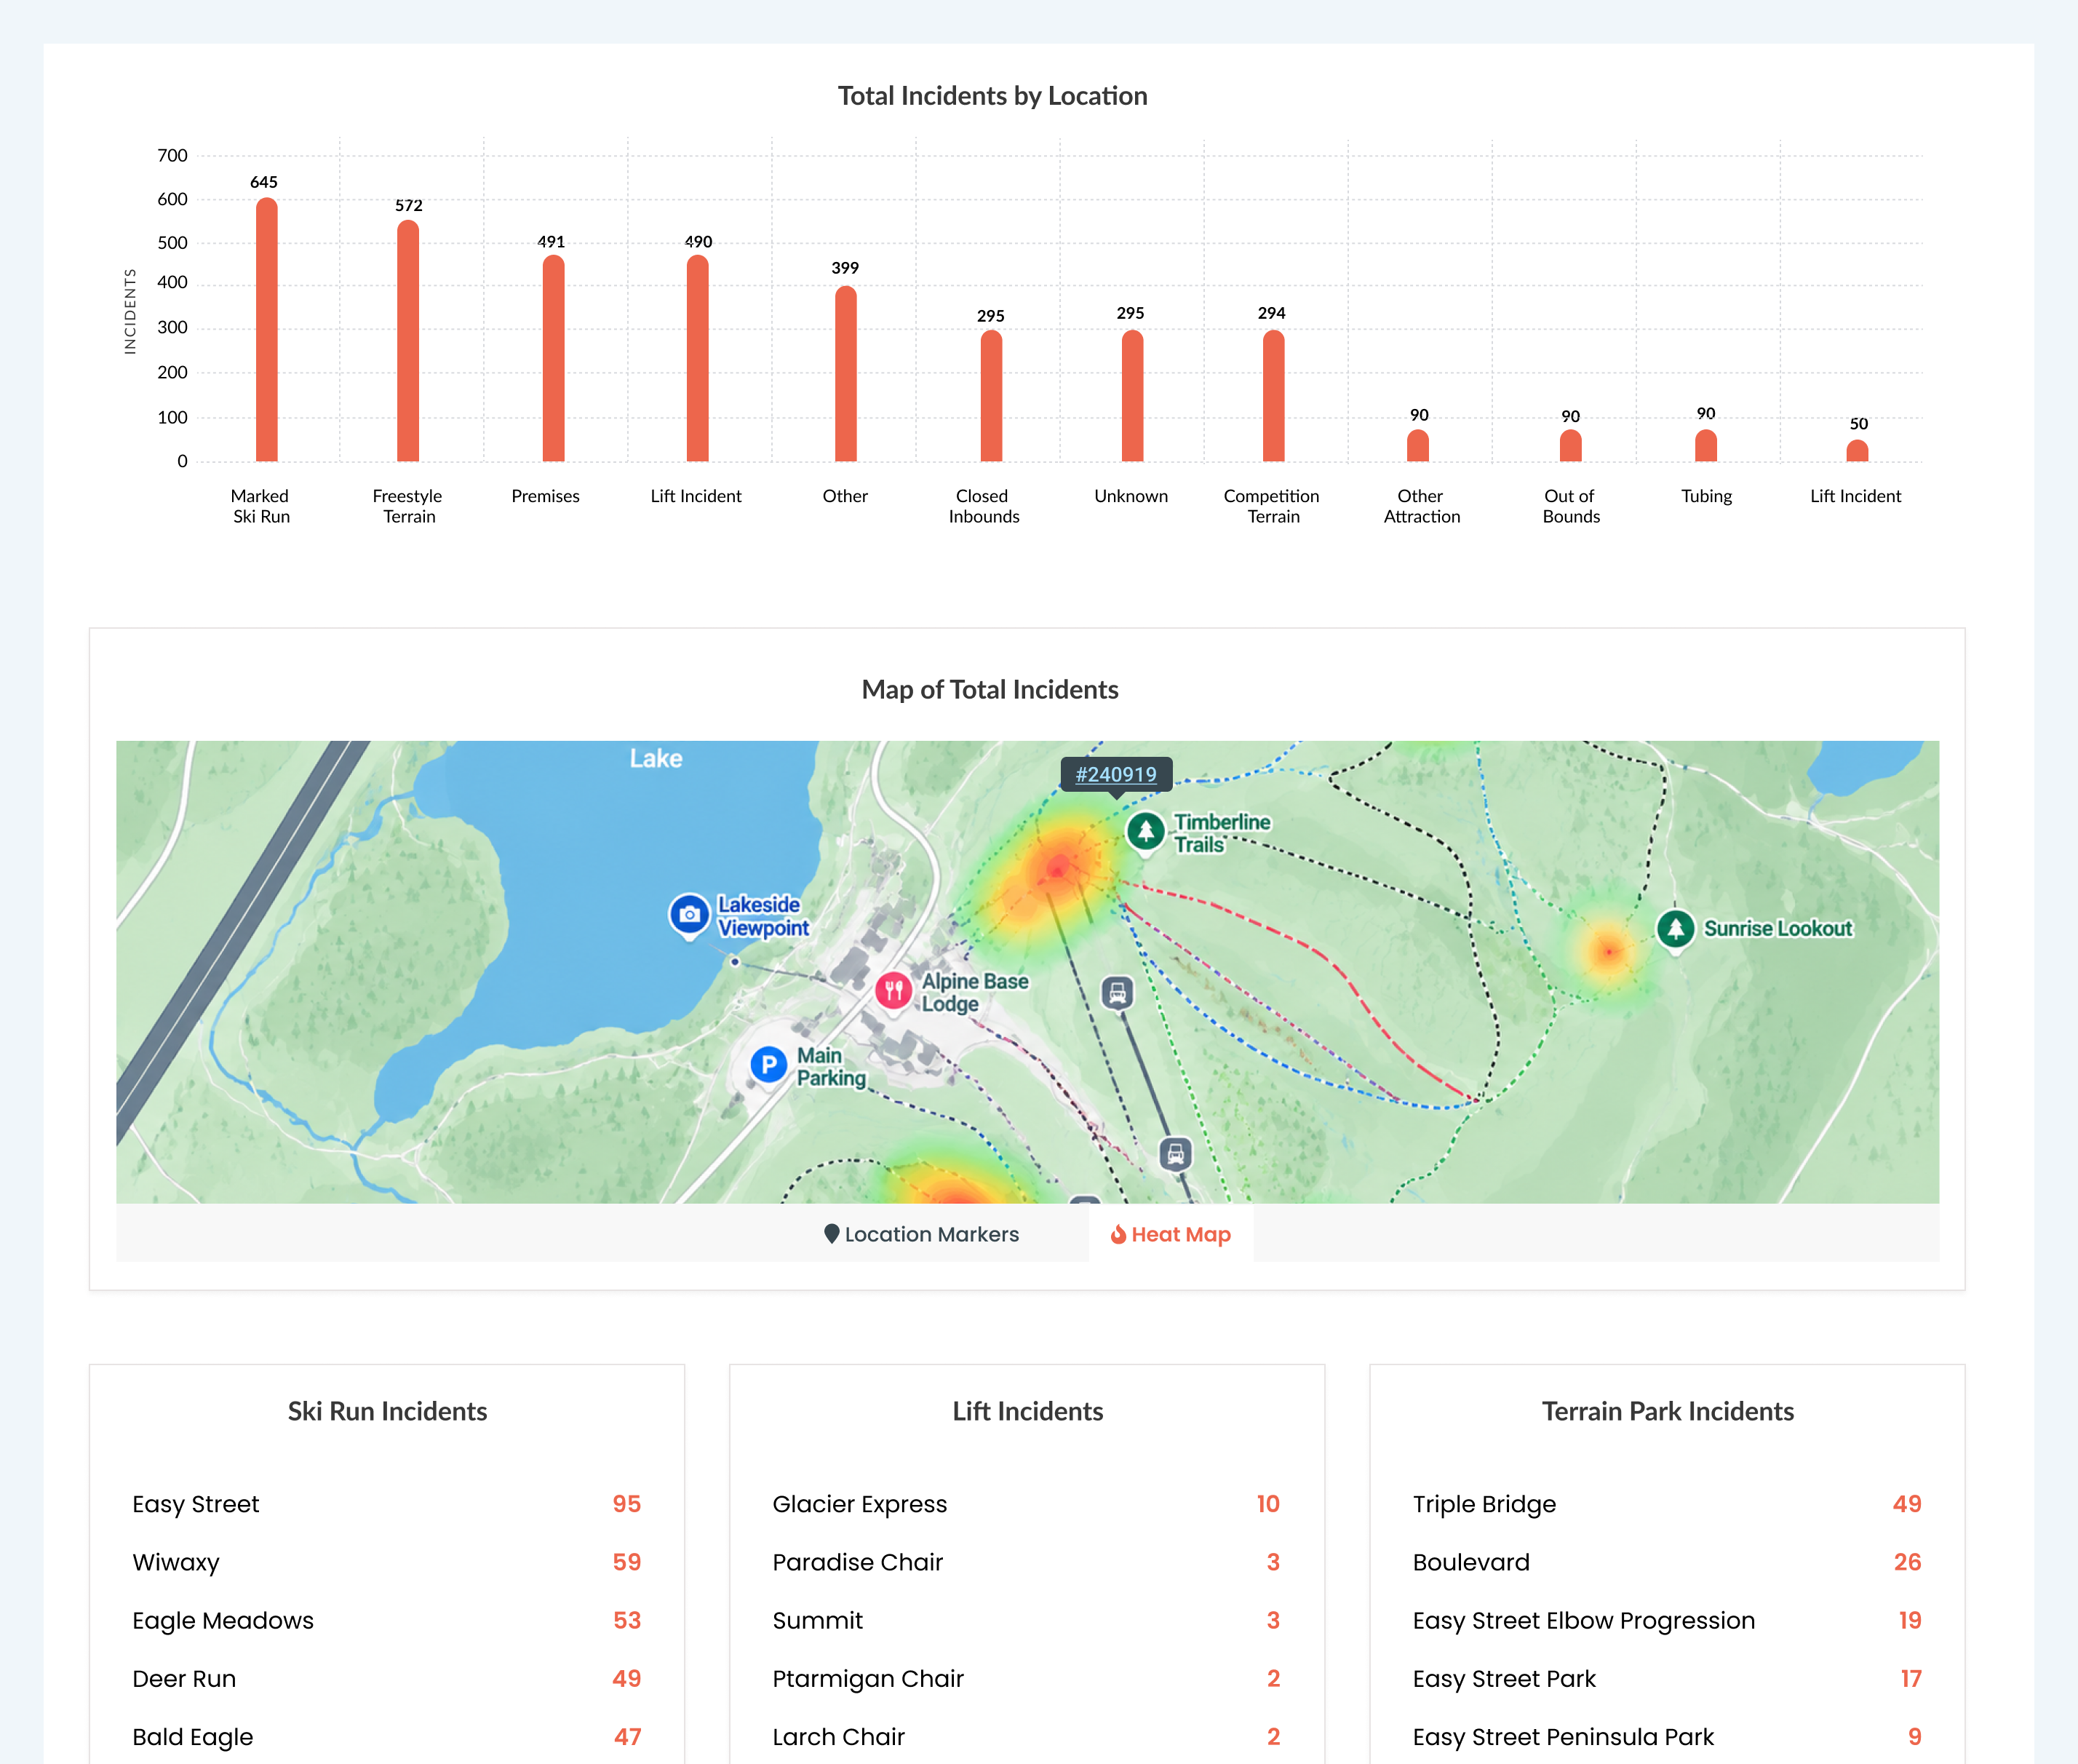
Pinpoint where incidents cluster on your mountain. Heat maps highlight hot zones and recurring risk areas so you can focus attention where it matters most.
Trends & Insights at a Glance
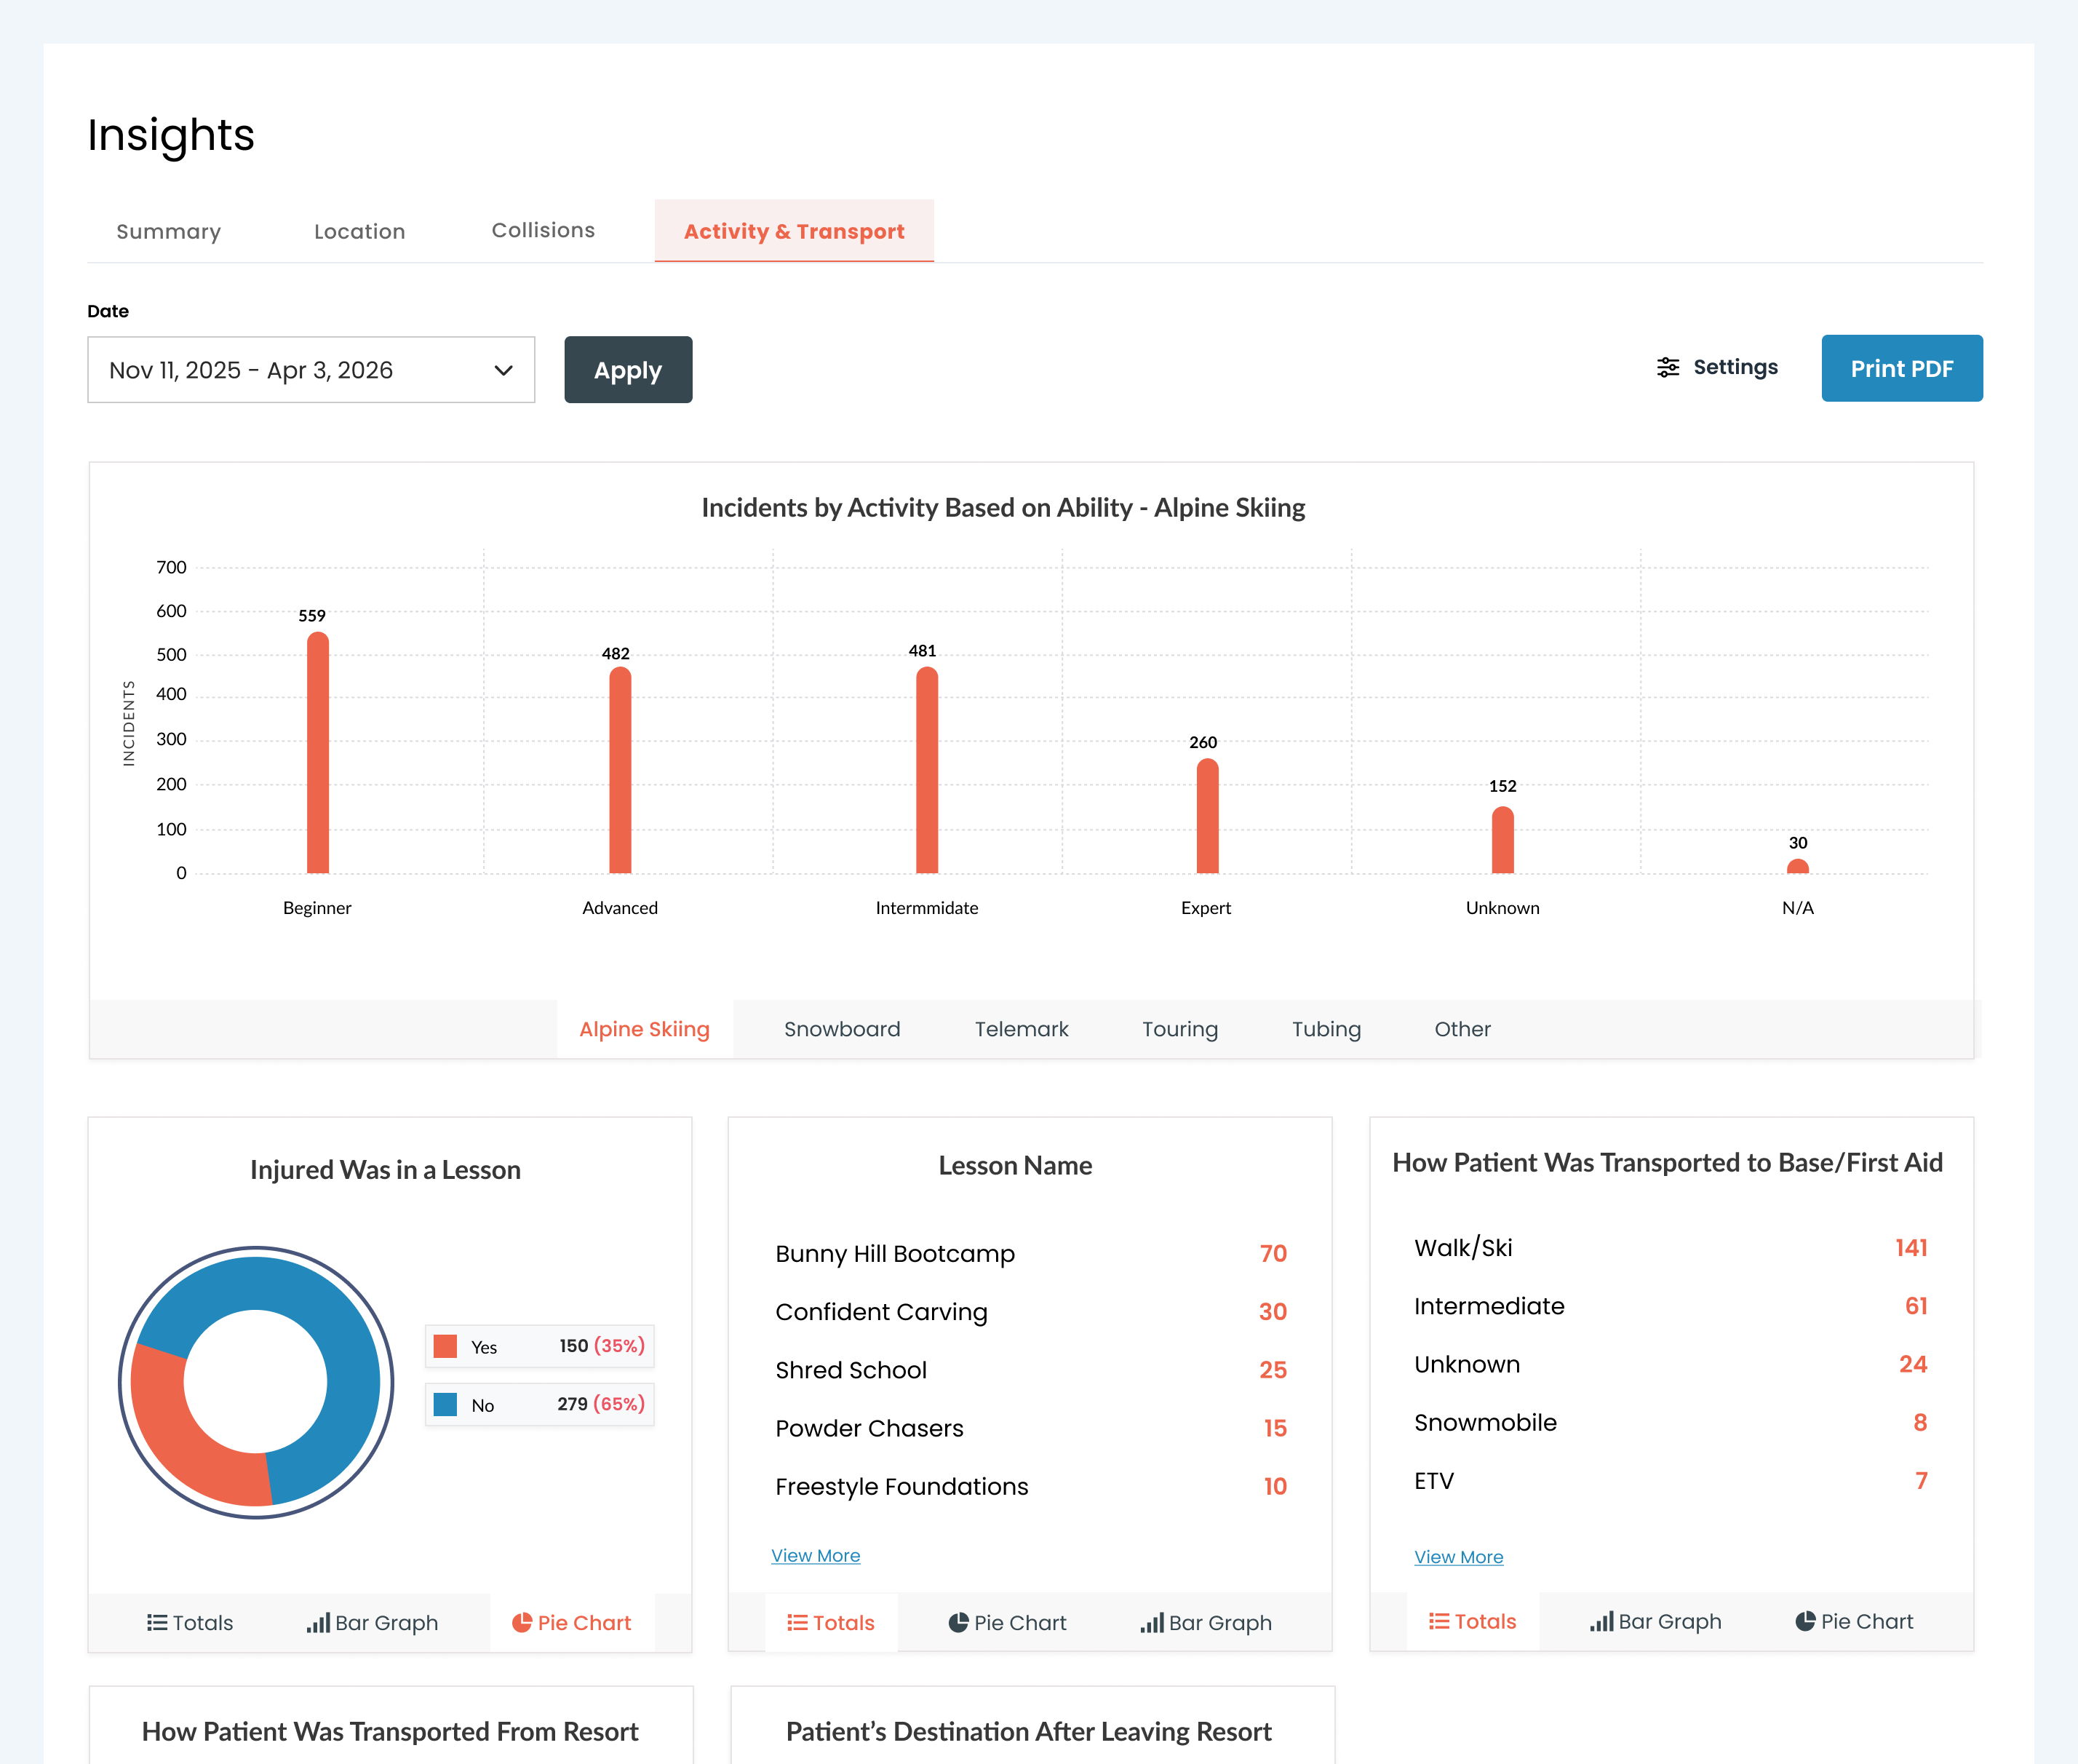
Track incident frequency, injury patterns and seasonal trends over time through customizable charts and filters. Access key metrics from the Manager Dashboard as new incidents are recorded, without manually building reports or exporting spreadsheets.
From Understanding Incidents to Preventing Them.
Every incident tells part of a bigger story. EDGEauditor Insights helps you connect the dots by revealing patterns in where, when and how incidents occur across your mountain.
Use these insights to identify areas that may need attention, evaluate recurring safety concerns and make more informed decisions about mountain operations. Instead of simply reviewing what happened, your team can use historical data to help reduce future risks.